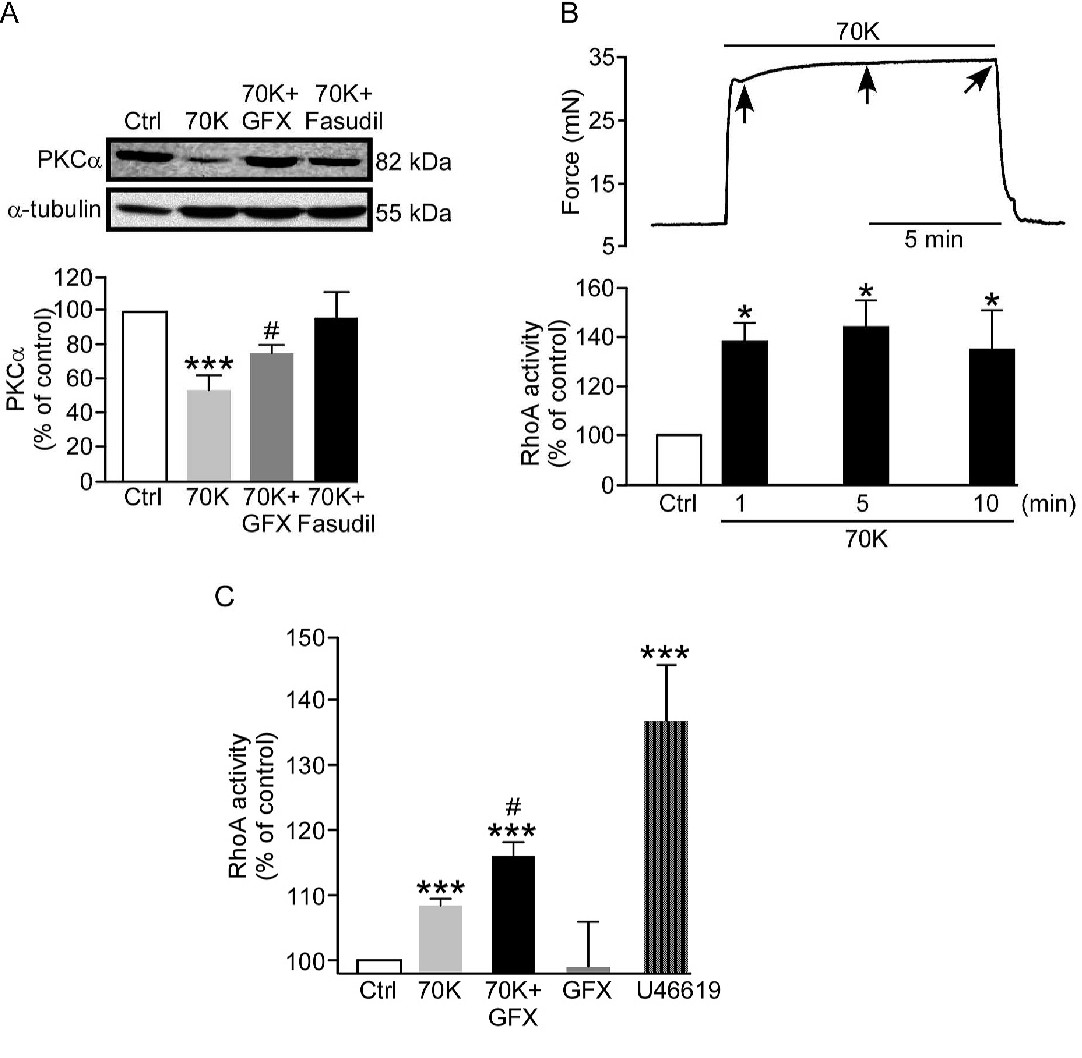
Fig. 2. Effect of PKCα inhibition on depolarization-induced RhoA activation. (A) Representative immunoblot (top) and analysis (bottom) illustrating the effects of PKC and ROCK inhibitors on PKCα protein levels in cytosolic extracts obtained from arterial rings bathed with 70K for 10 min (n = 6). 70K-induced PKCα translocation was reverted with GFX (0.5 µM) or fasudil (1 µM). (B) Representative trace of 70K-evoked contraction (top) and statistical analysis of depolarization-induced RhoA activation (bottom). Arrows indicate the times at which arterial rings were frozen for posterior measurement of RhoA activity with the G-LISA test (n = 10). (C) RhoA activity in response to different stimuli. In the 70K+GFX samples, arteries were preincubated with GFX (0.5 µM) for 30 min, and then exposed to 70K for 10 min. U46619 (1 µM) was used as positive control (n = 5). Statistical significance was calculated by one-way ANOVA or Kruskal-Wallis test followed by either Student-Newman-Keuls t-test, Tukey, or MannWhitney U test, where appropriate. *P<0.05, ***P<0.005 vs. control; #P<0.05 vs.70K.